| |
 |
![]()
Just look at that Periphelion graph! It's very regular, there is even a slope to the left and right in process. I'll bet if you did this same execise for 1980 to 1990 you'd find regular waves all around!
Offered by Nancy.
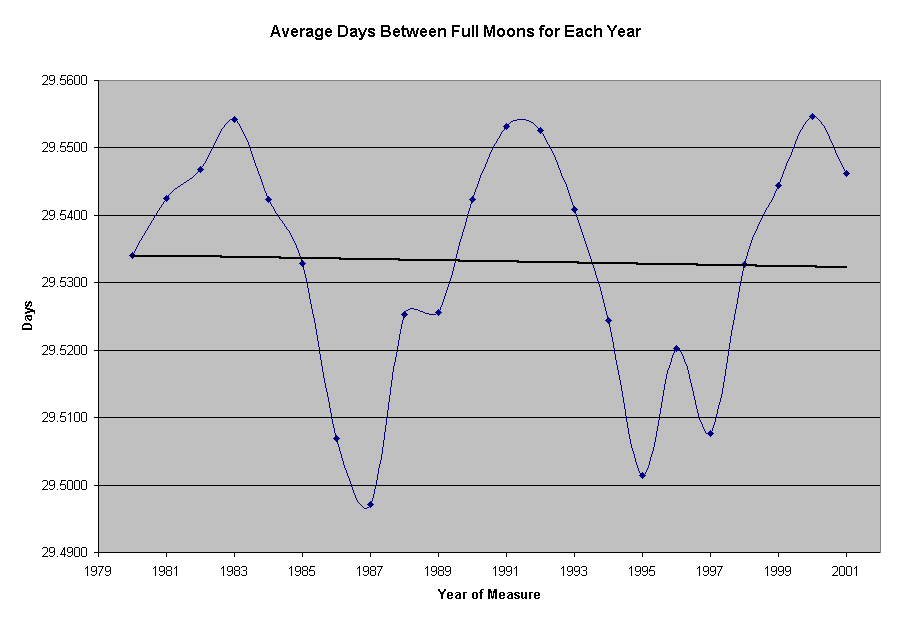
The major point here is: The Perihelion and Equinoxes curves are measuring two very different conditions with different criteria therefore the different results are to be expected. If found the data for 1980 to 1990 for Full Moons and plotted it.
Offered by Mike.

Note the charts for the Full Moons in the decade of the 1990s show a dramatic short full moon month trend, the full moon coming early. But in the chart for two decades it shows this same trend but less so as it is absorbing the trend from the 1990’s. My guess is that the 1980’s alone would have no such short month trend. This puts the analysis of the Navy data, above, in sync with what Frank stated, that the stats had been manipulated so that the full moon was coming early, per the stats, so the fact that it was coming later as we approached 2003 would not be so noticeable!
Offered by Nancy.